


Your Personalized Social Security Report
Understand Your Options. Maximize Your Benefits.
We are not affiliated with, endorsed by, or associated with the Social Security Administration or any other government agency or entity. The information provided through this website, seminars, classes, and materials is for educational purposes only.
For official information regarding Social Security, please visit SSA.gov
What Is The Social Security Report?
Your Social Security Report is a personalized, data-driven document that gives you the full picture of your benefits and helps you make the most informed decision about when and how to file for your benefits.
It’s built using the #1-rated Social Security analysis software in the country. It mimics the actual Social Security algorithm, giving you the most accurate report available outside of the government’s own system.
What’s Included In The Report?
Personalized Filing Strategy
Get a detailed recommendation on when and how to file for benefits based on your age, earnings history, and marital status.
Benefit Projections
See how much you can expect to receive at various ages and custom benchmarks so you can plan ahead with confidence.
Spousal & Survivor Scenarios
If you’re married, widowed, or divorced, your report includes strategies and comparisons to help coordinate benefits and optimize outcomes for both individuals.
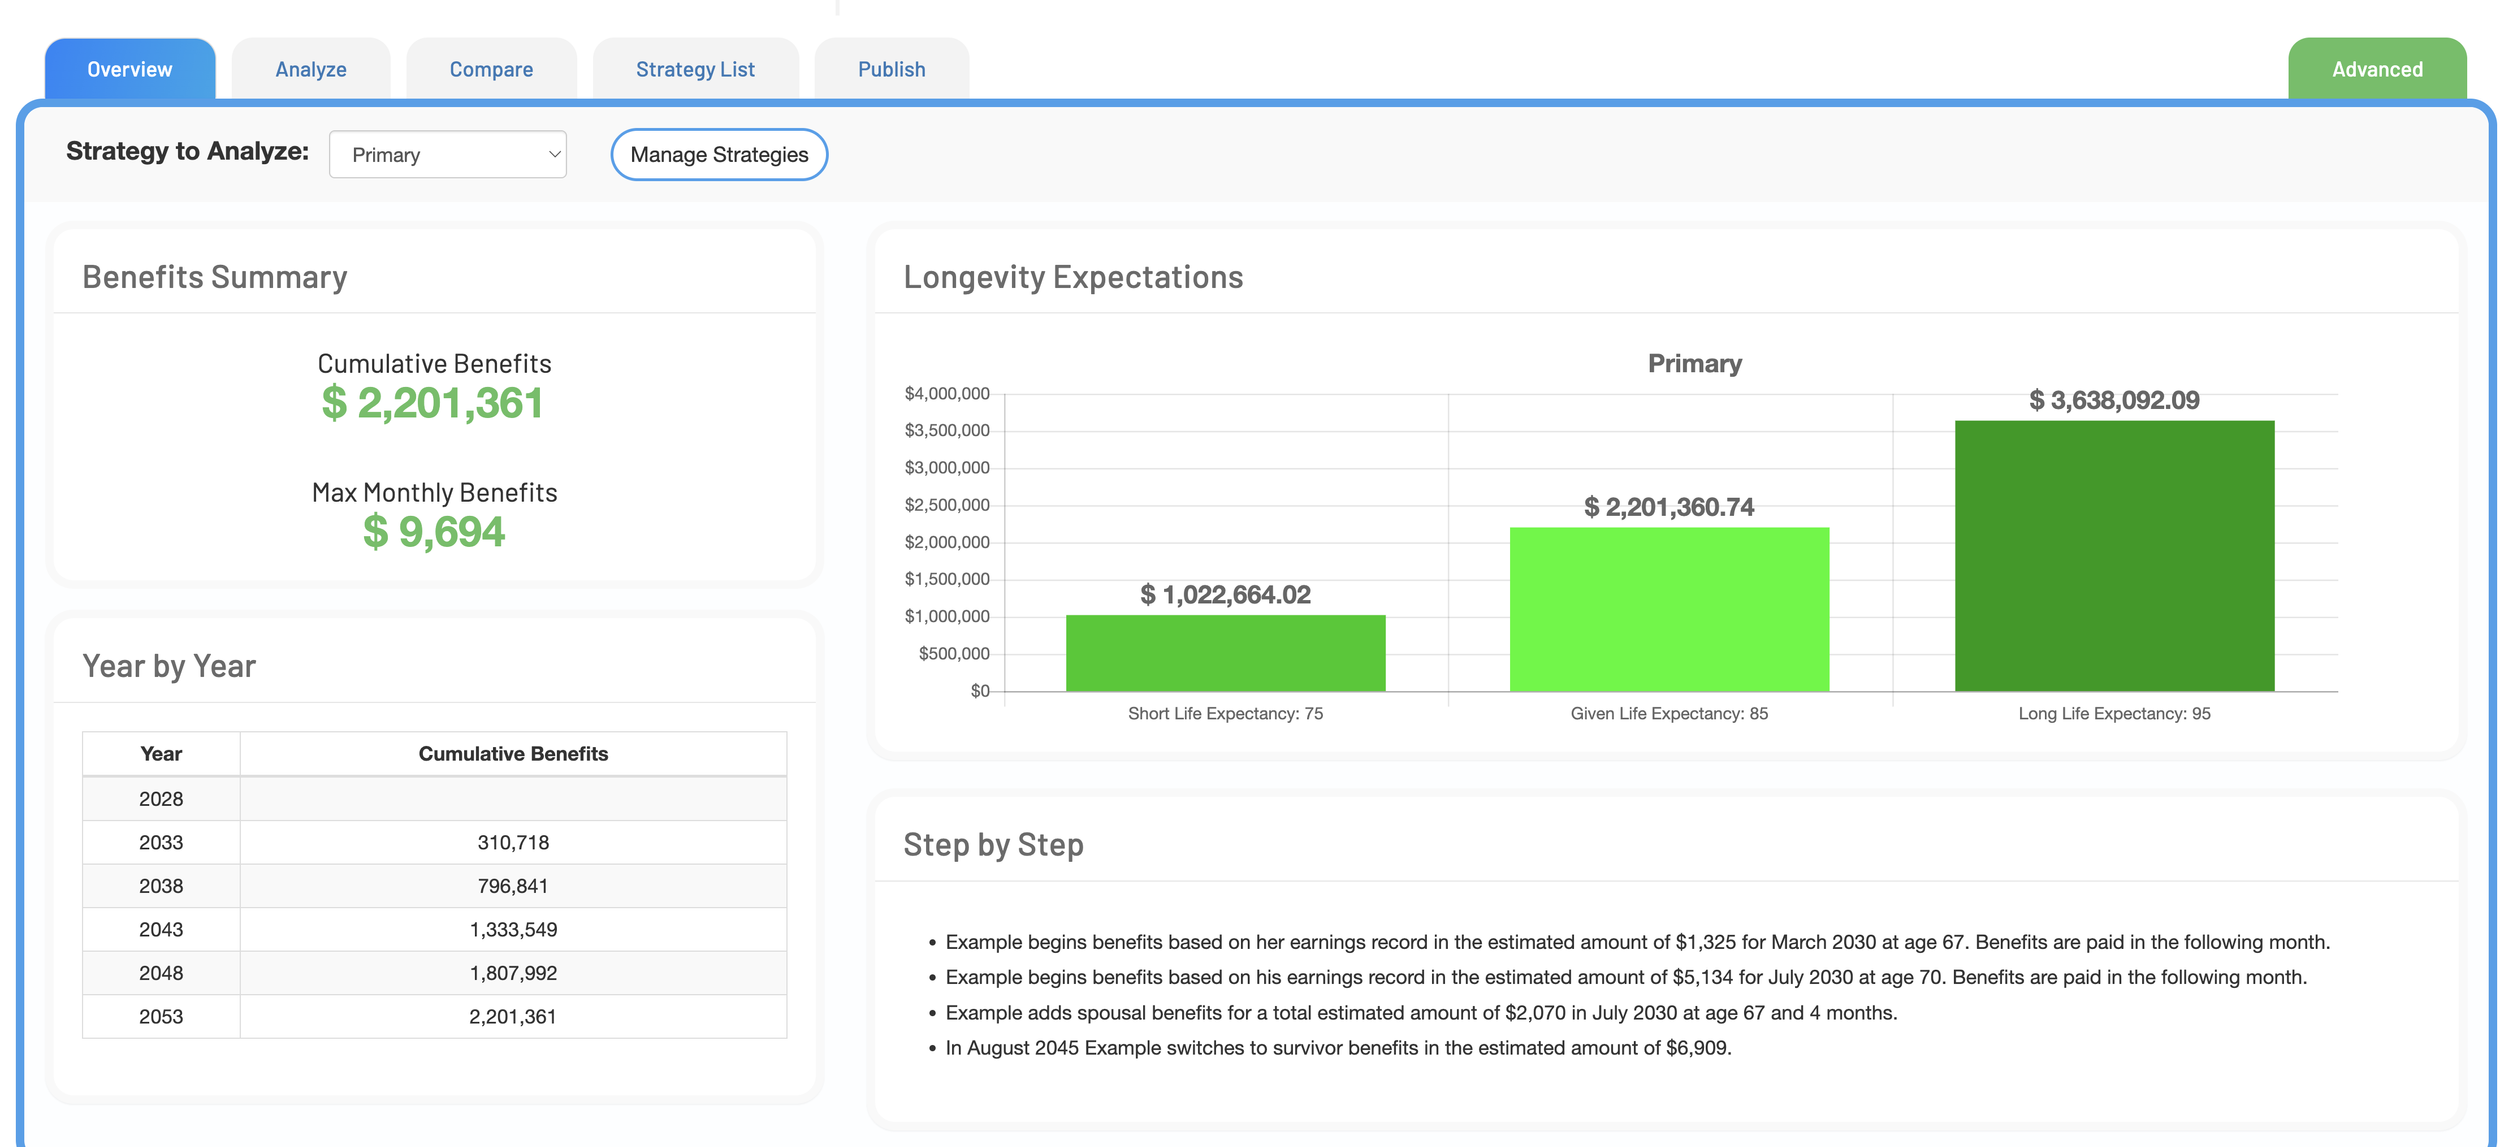
Lifetime Value Comparison
Understand the total value of benefits over time depending on when you file.
Key Dates & Deadlines
No more guesswork, we highlight important filing windows and eligibility timelines so nothing slips through the cracks.
Plain-English Explanations
No jargon. Just real answers. Every section is explained clearly so you don’t need to be a Social Security expert to understand your options.

Why It Matters
Filing at the wrong time, even by a few months, can cost you tens of thousands of dollars over your lifetime.
This report empowers you to make the smartest choice possible, backed by data and strategy.
Ready to See Your Numbers?
Start with a free consultation and take control of your retirement planning.
Example Report
